

Real Estate Developers
Comply with biodiversity regulations efficiently with automated reporting and analysis

Urban Landowners
Evaluate potential for green roofs and urban planning with comprehensive habitat assessment

Municipalities
Effectively manage green infrastructure at scale with data-driven insights
I led the project kickoff and facilitated strategy workshops with a multidisciplinary team including ecologists, AI specialists, remote sensing experts, CTO, and engineers. This process allowed us to identify critical jobs-to-be-done and technical requirements.
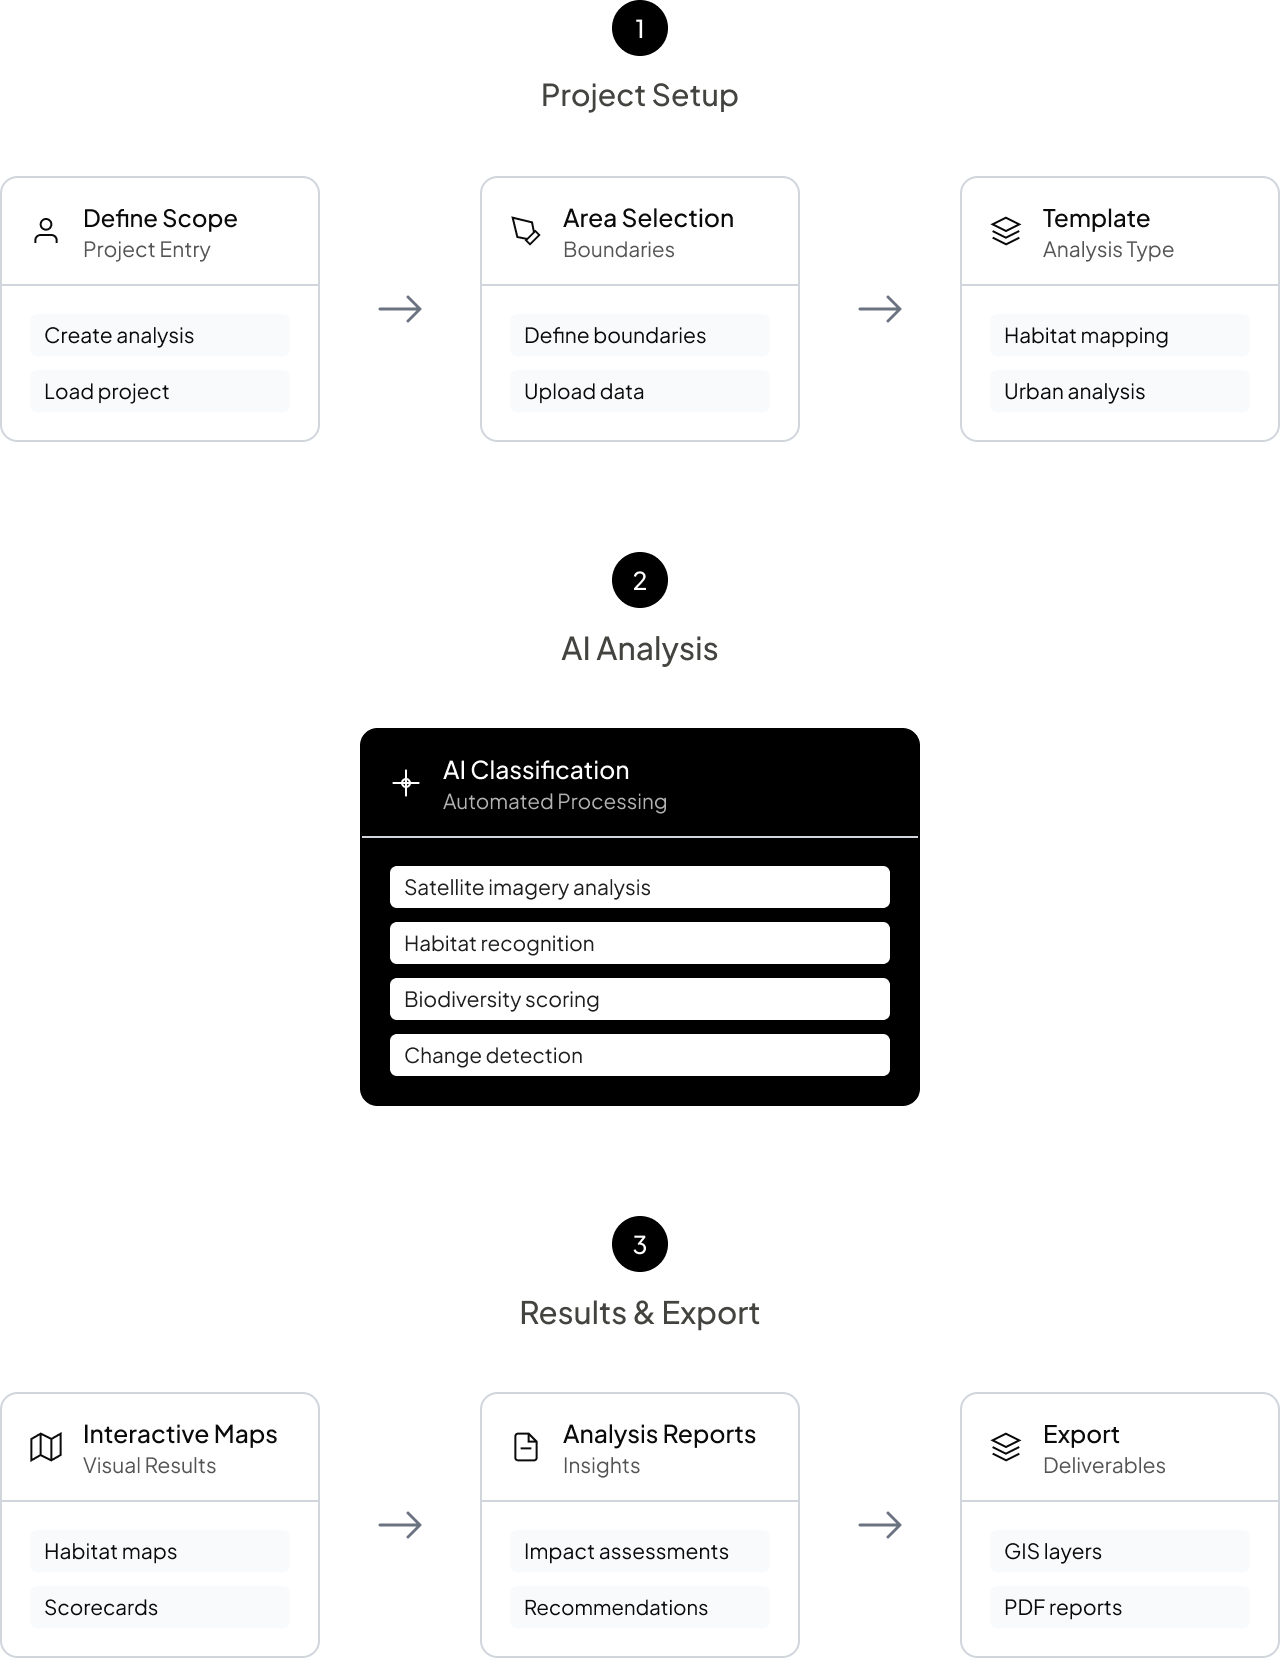
Research & Strategy
• Stakeholder workshops
• Regulatory requirement analysis
• User journey mapping
• Technical feasibility assessment
Design & Validation
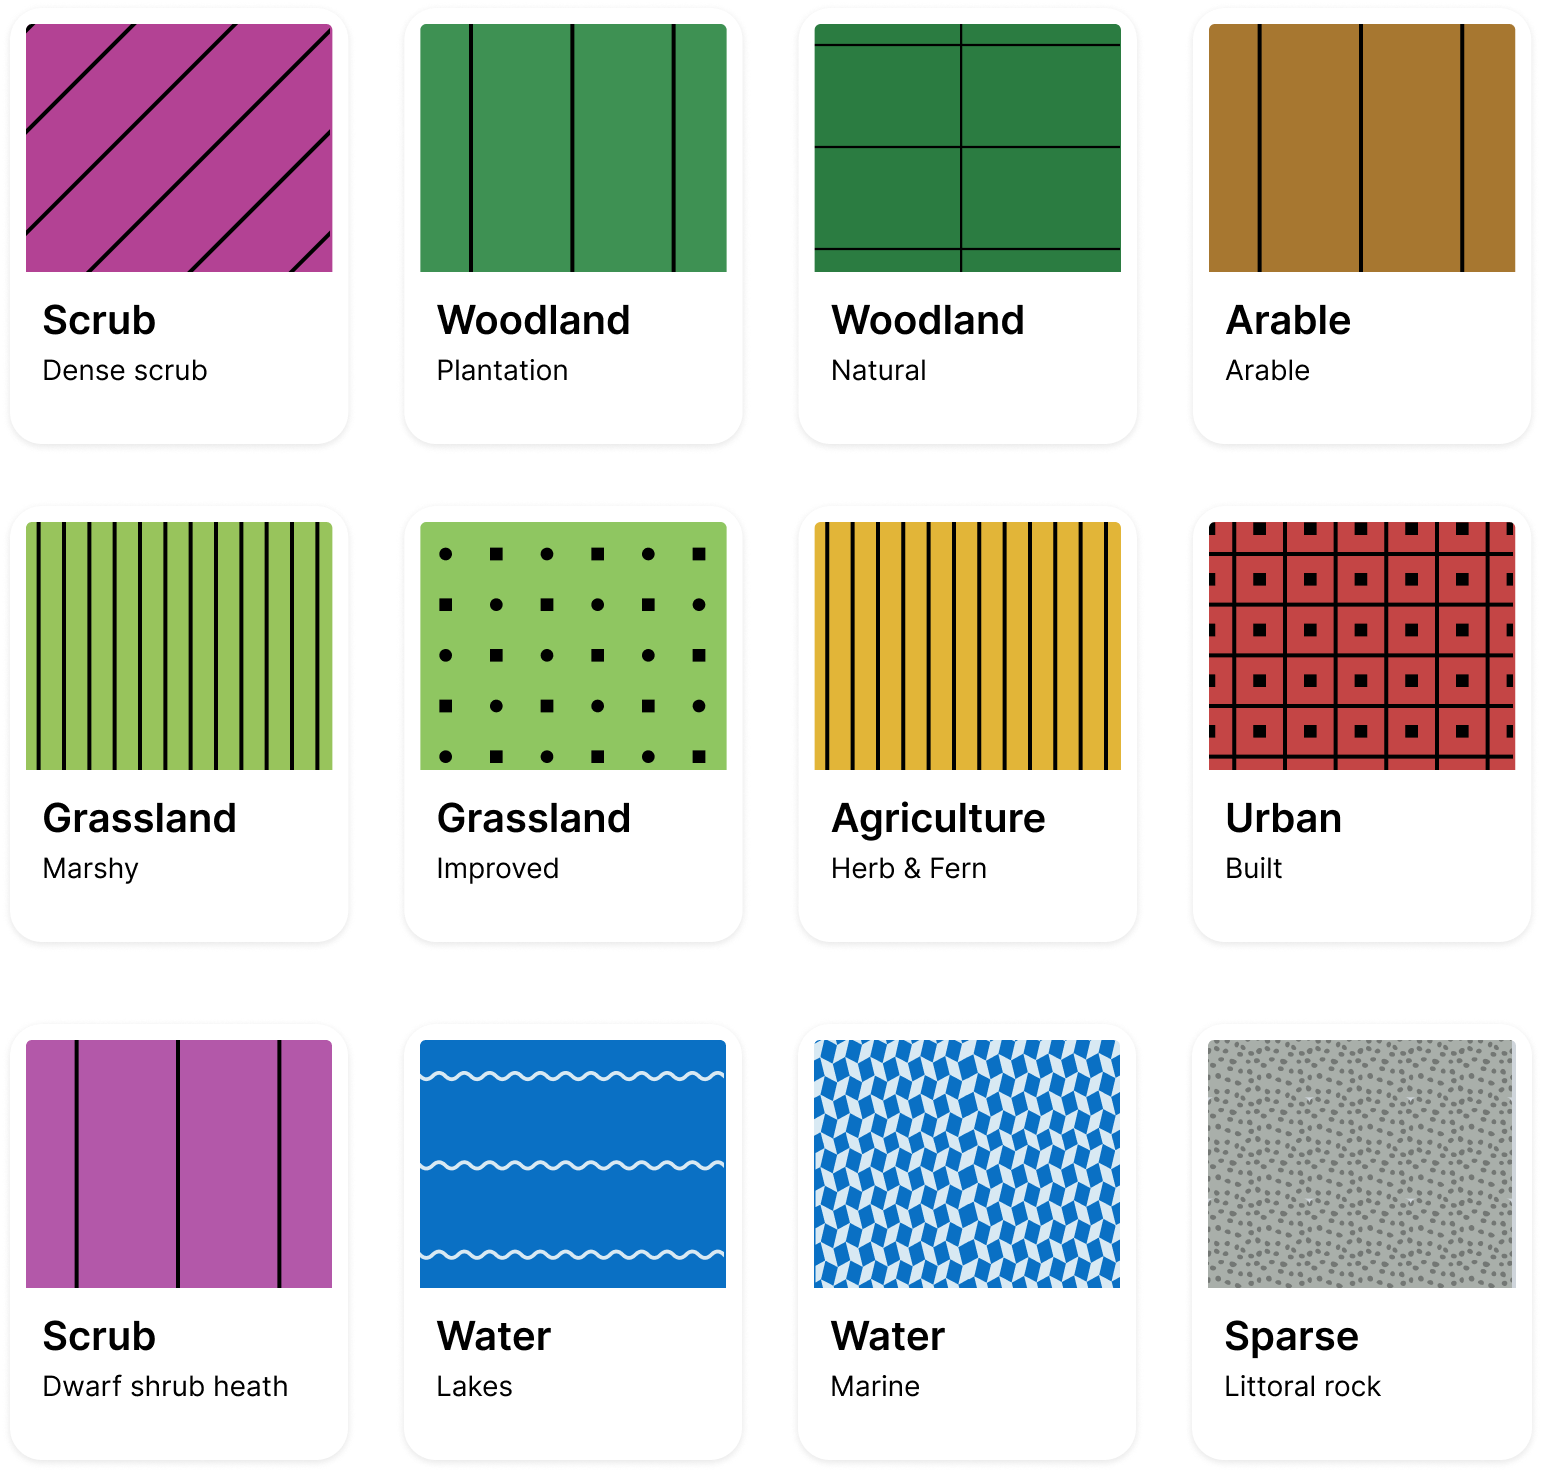
• Visual system development
• Dashboard interface design
• Accessibility testing
• User feedback integration
Implementation
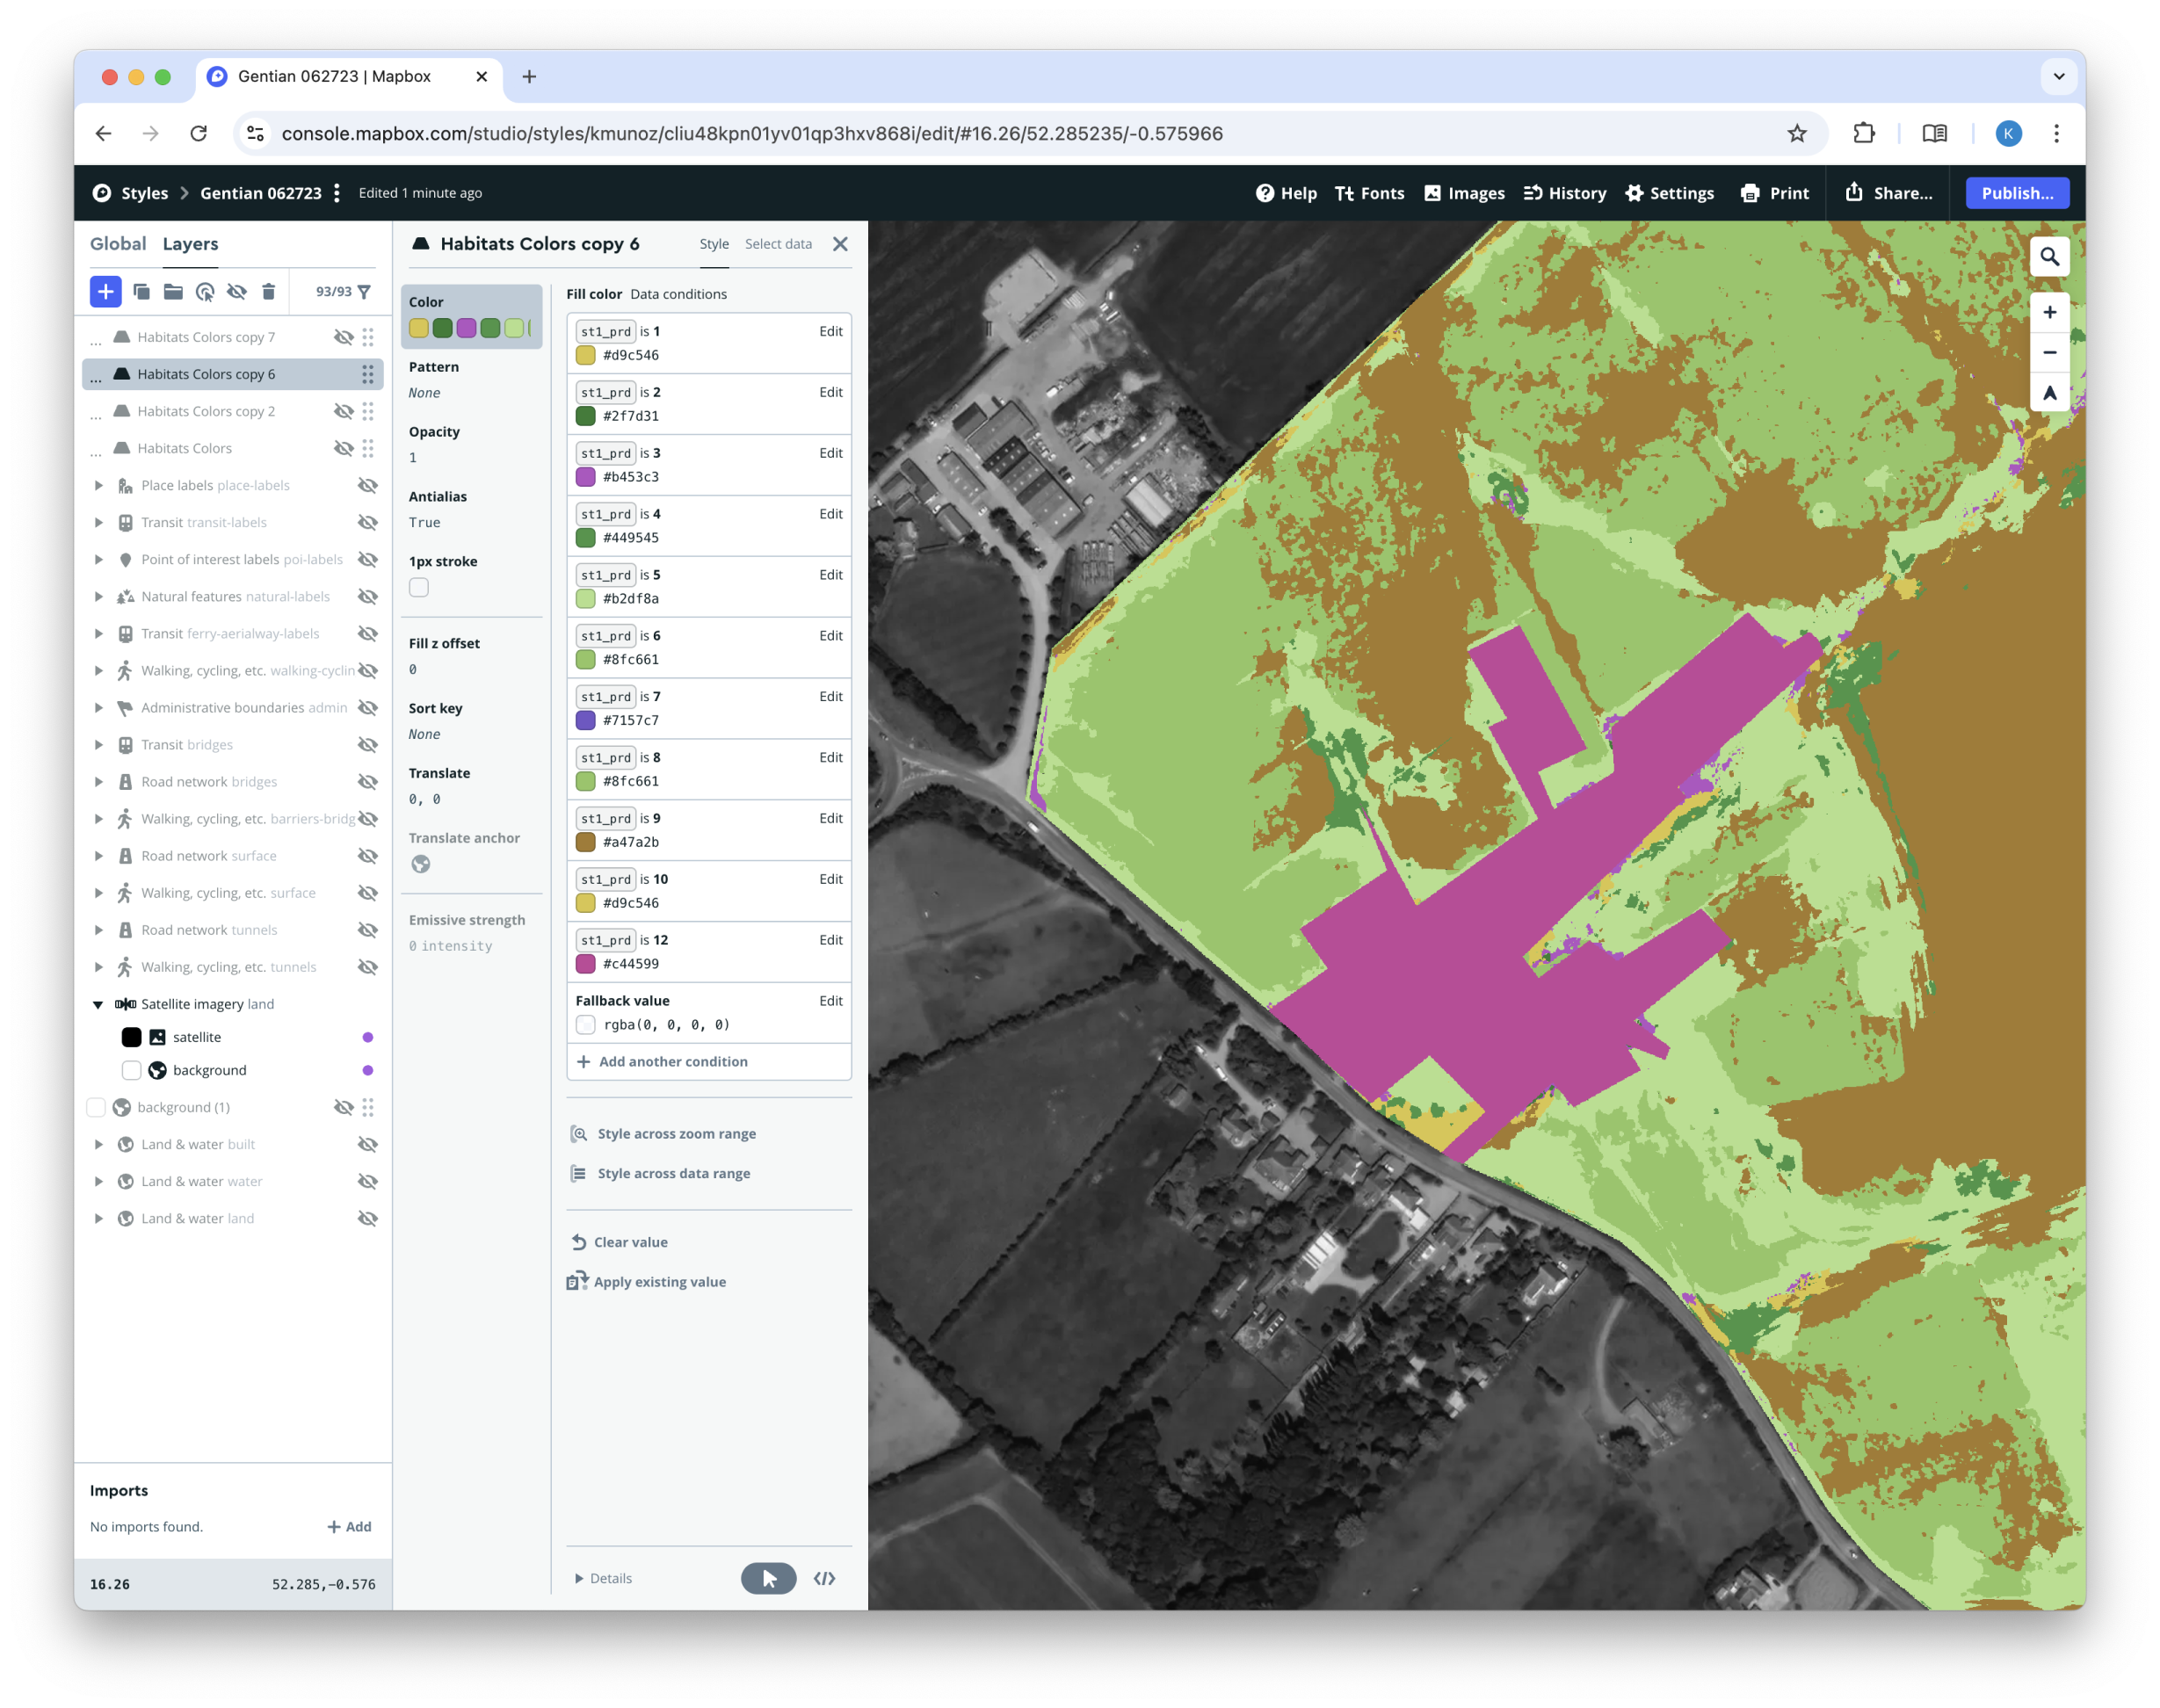
• Mapbox style integration
• Component development
• Design system documentation
• Engineering support


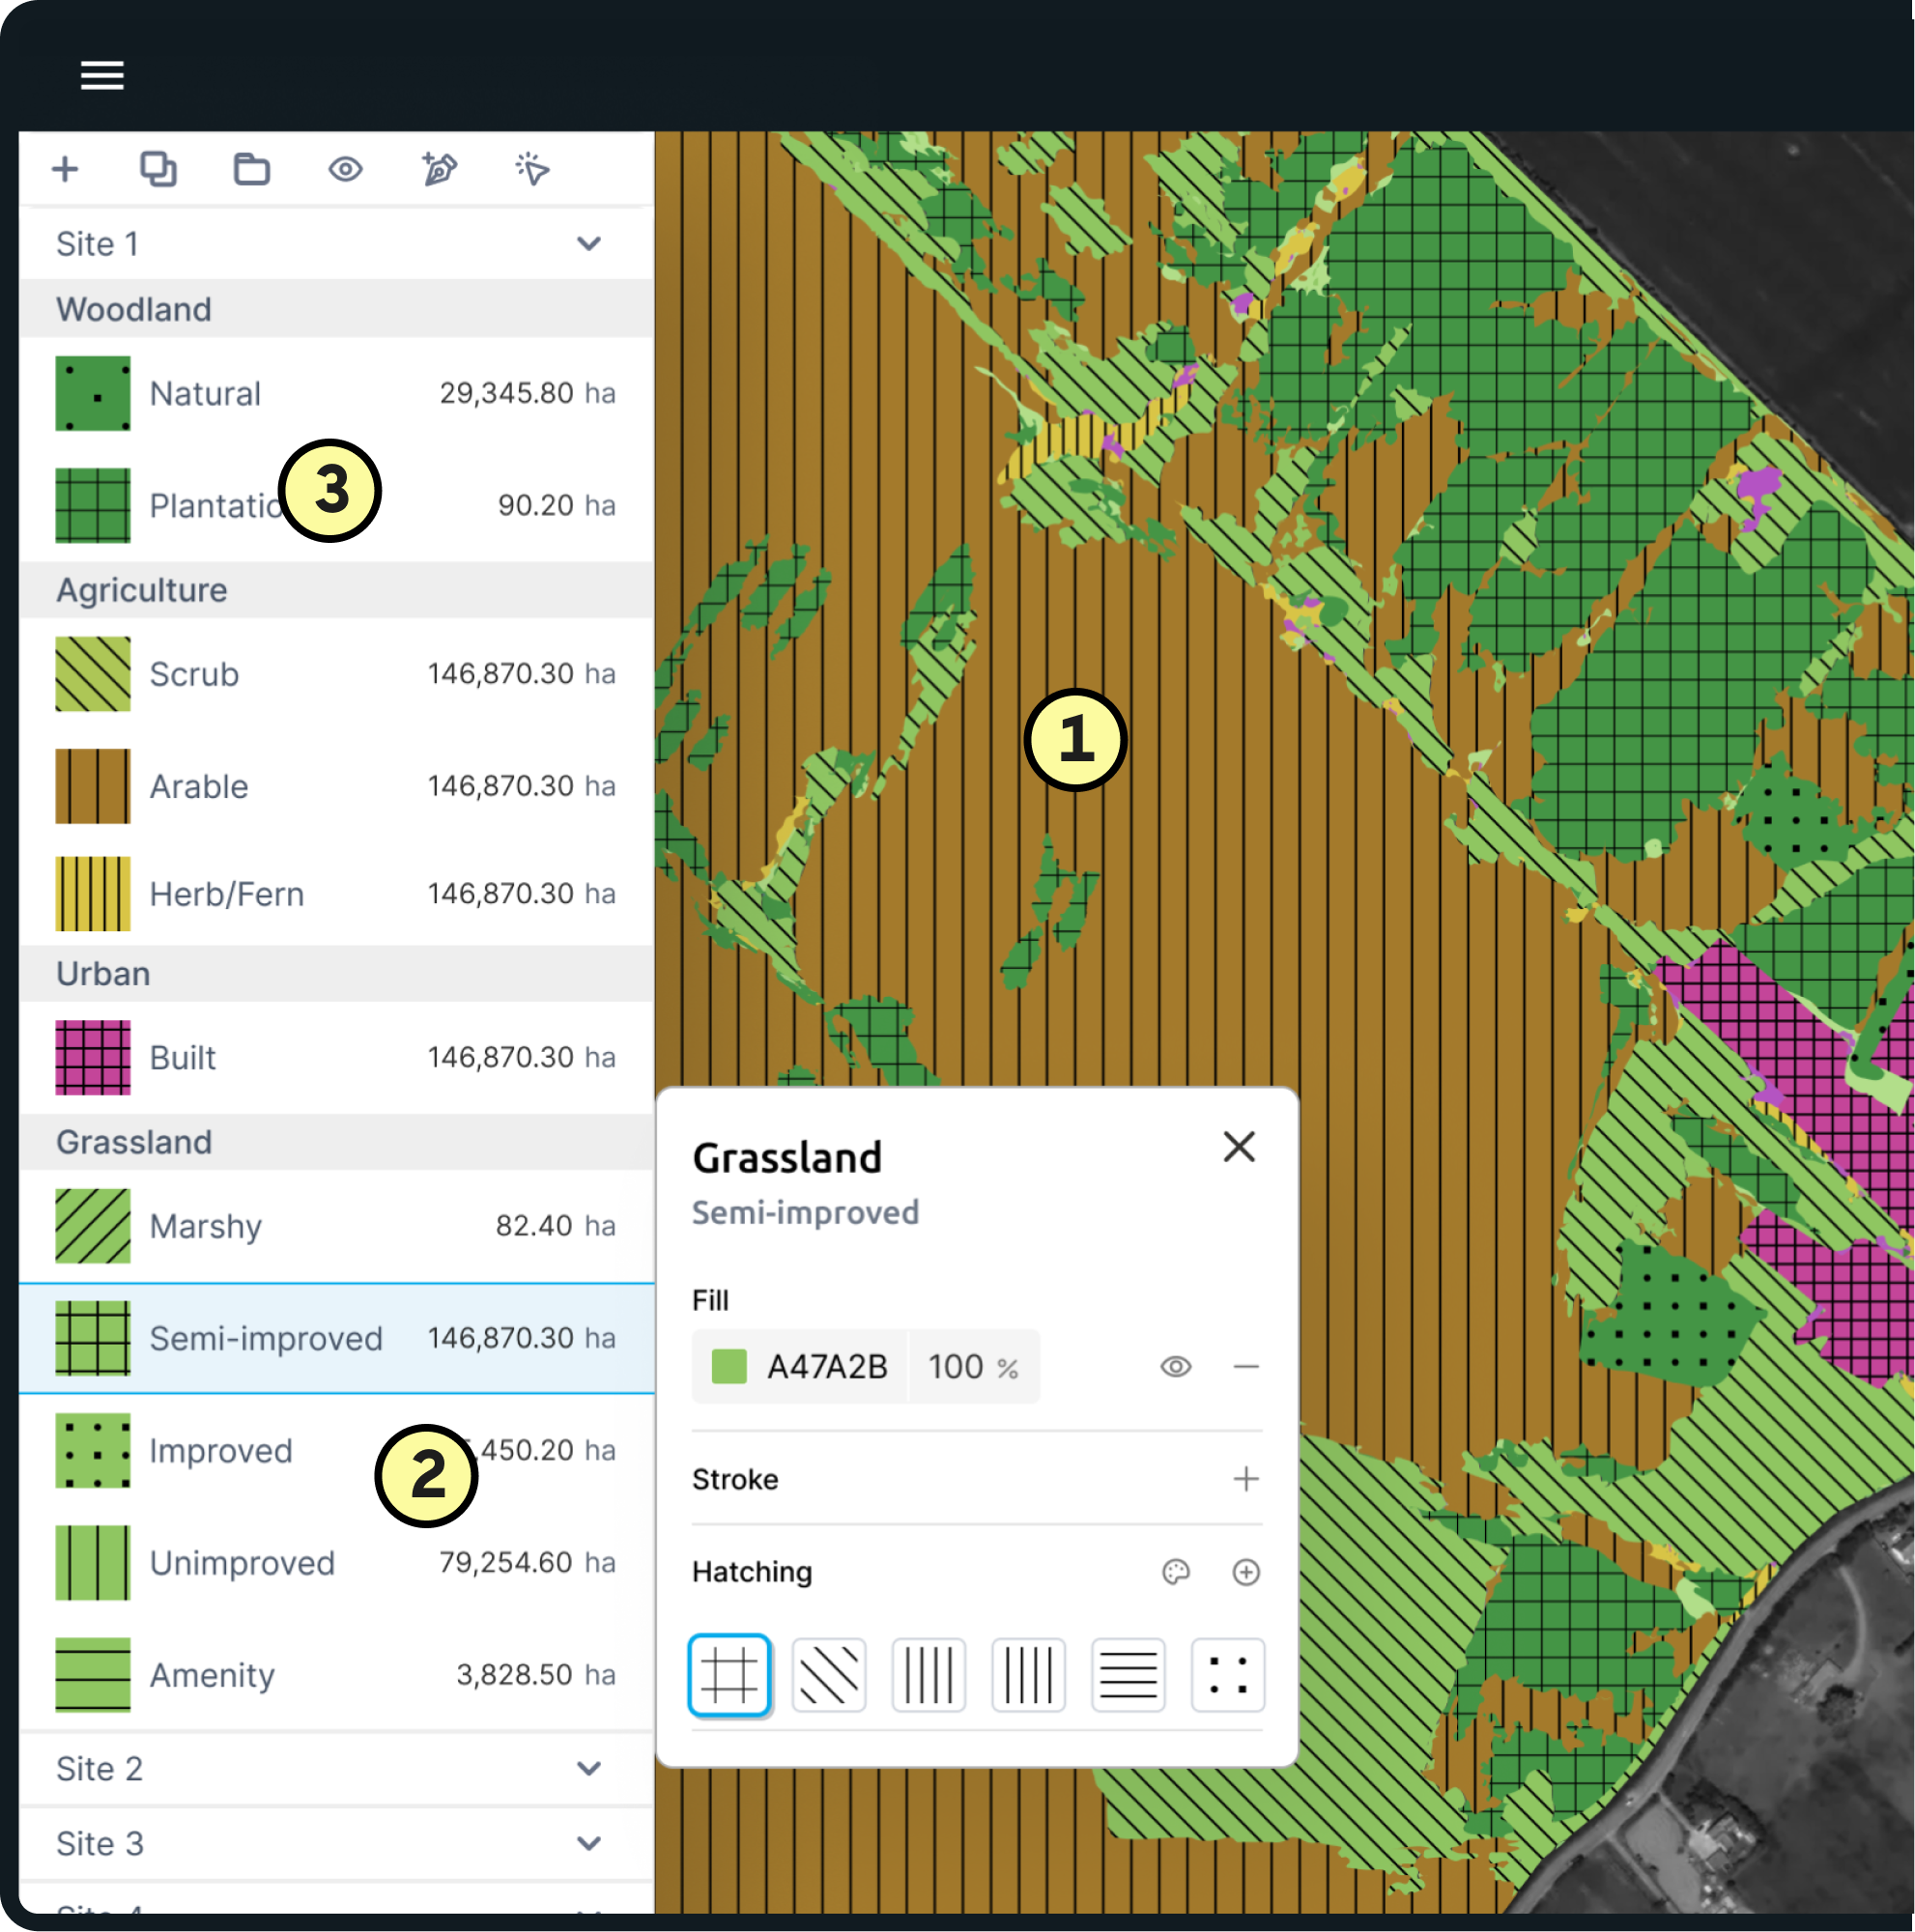
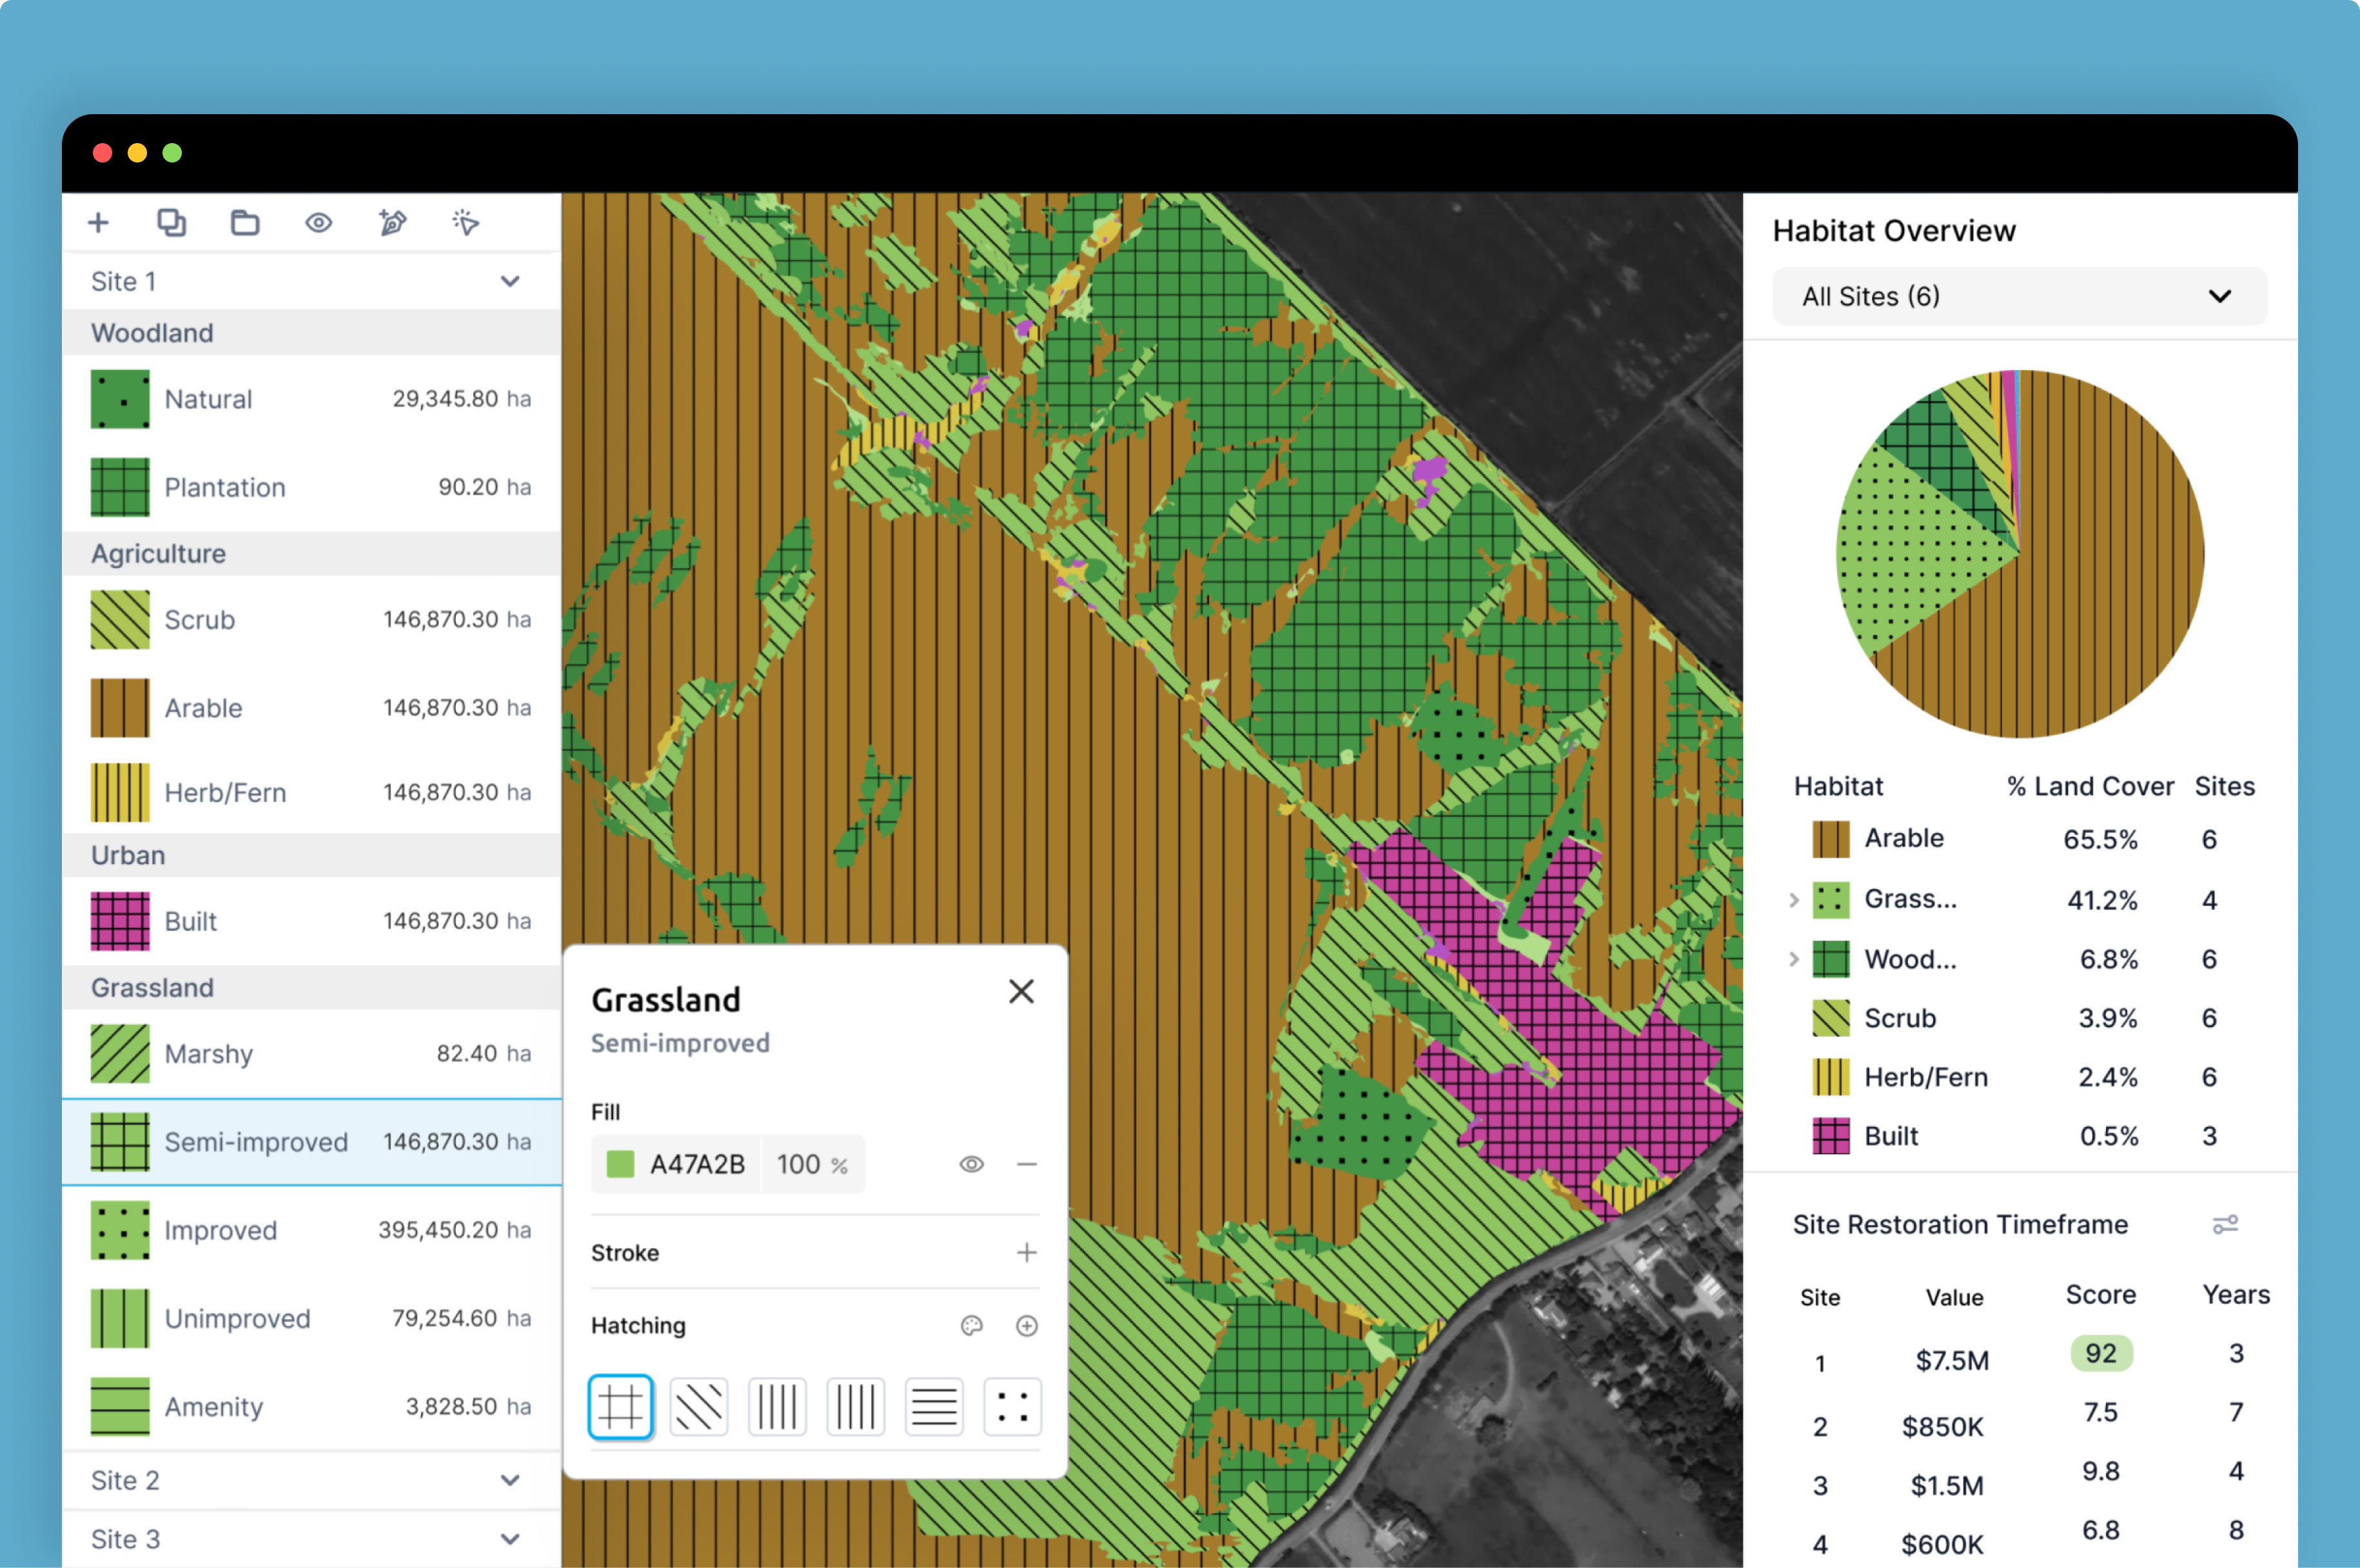
Visual Editing
Adjust fill color, stroke, and pattern to correct classifications or tailor for different audiences while maintaining data integrity
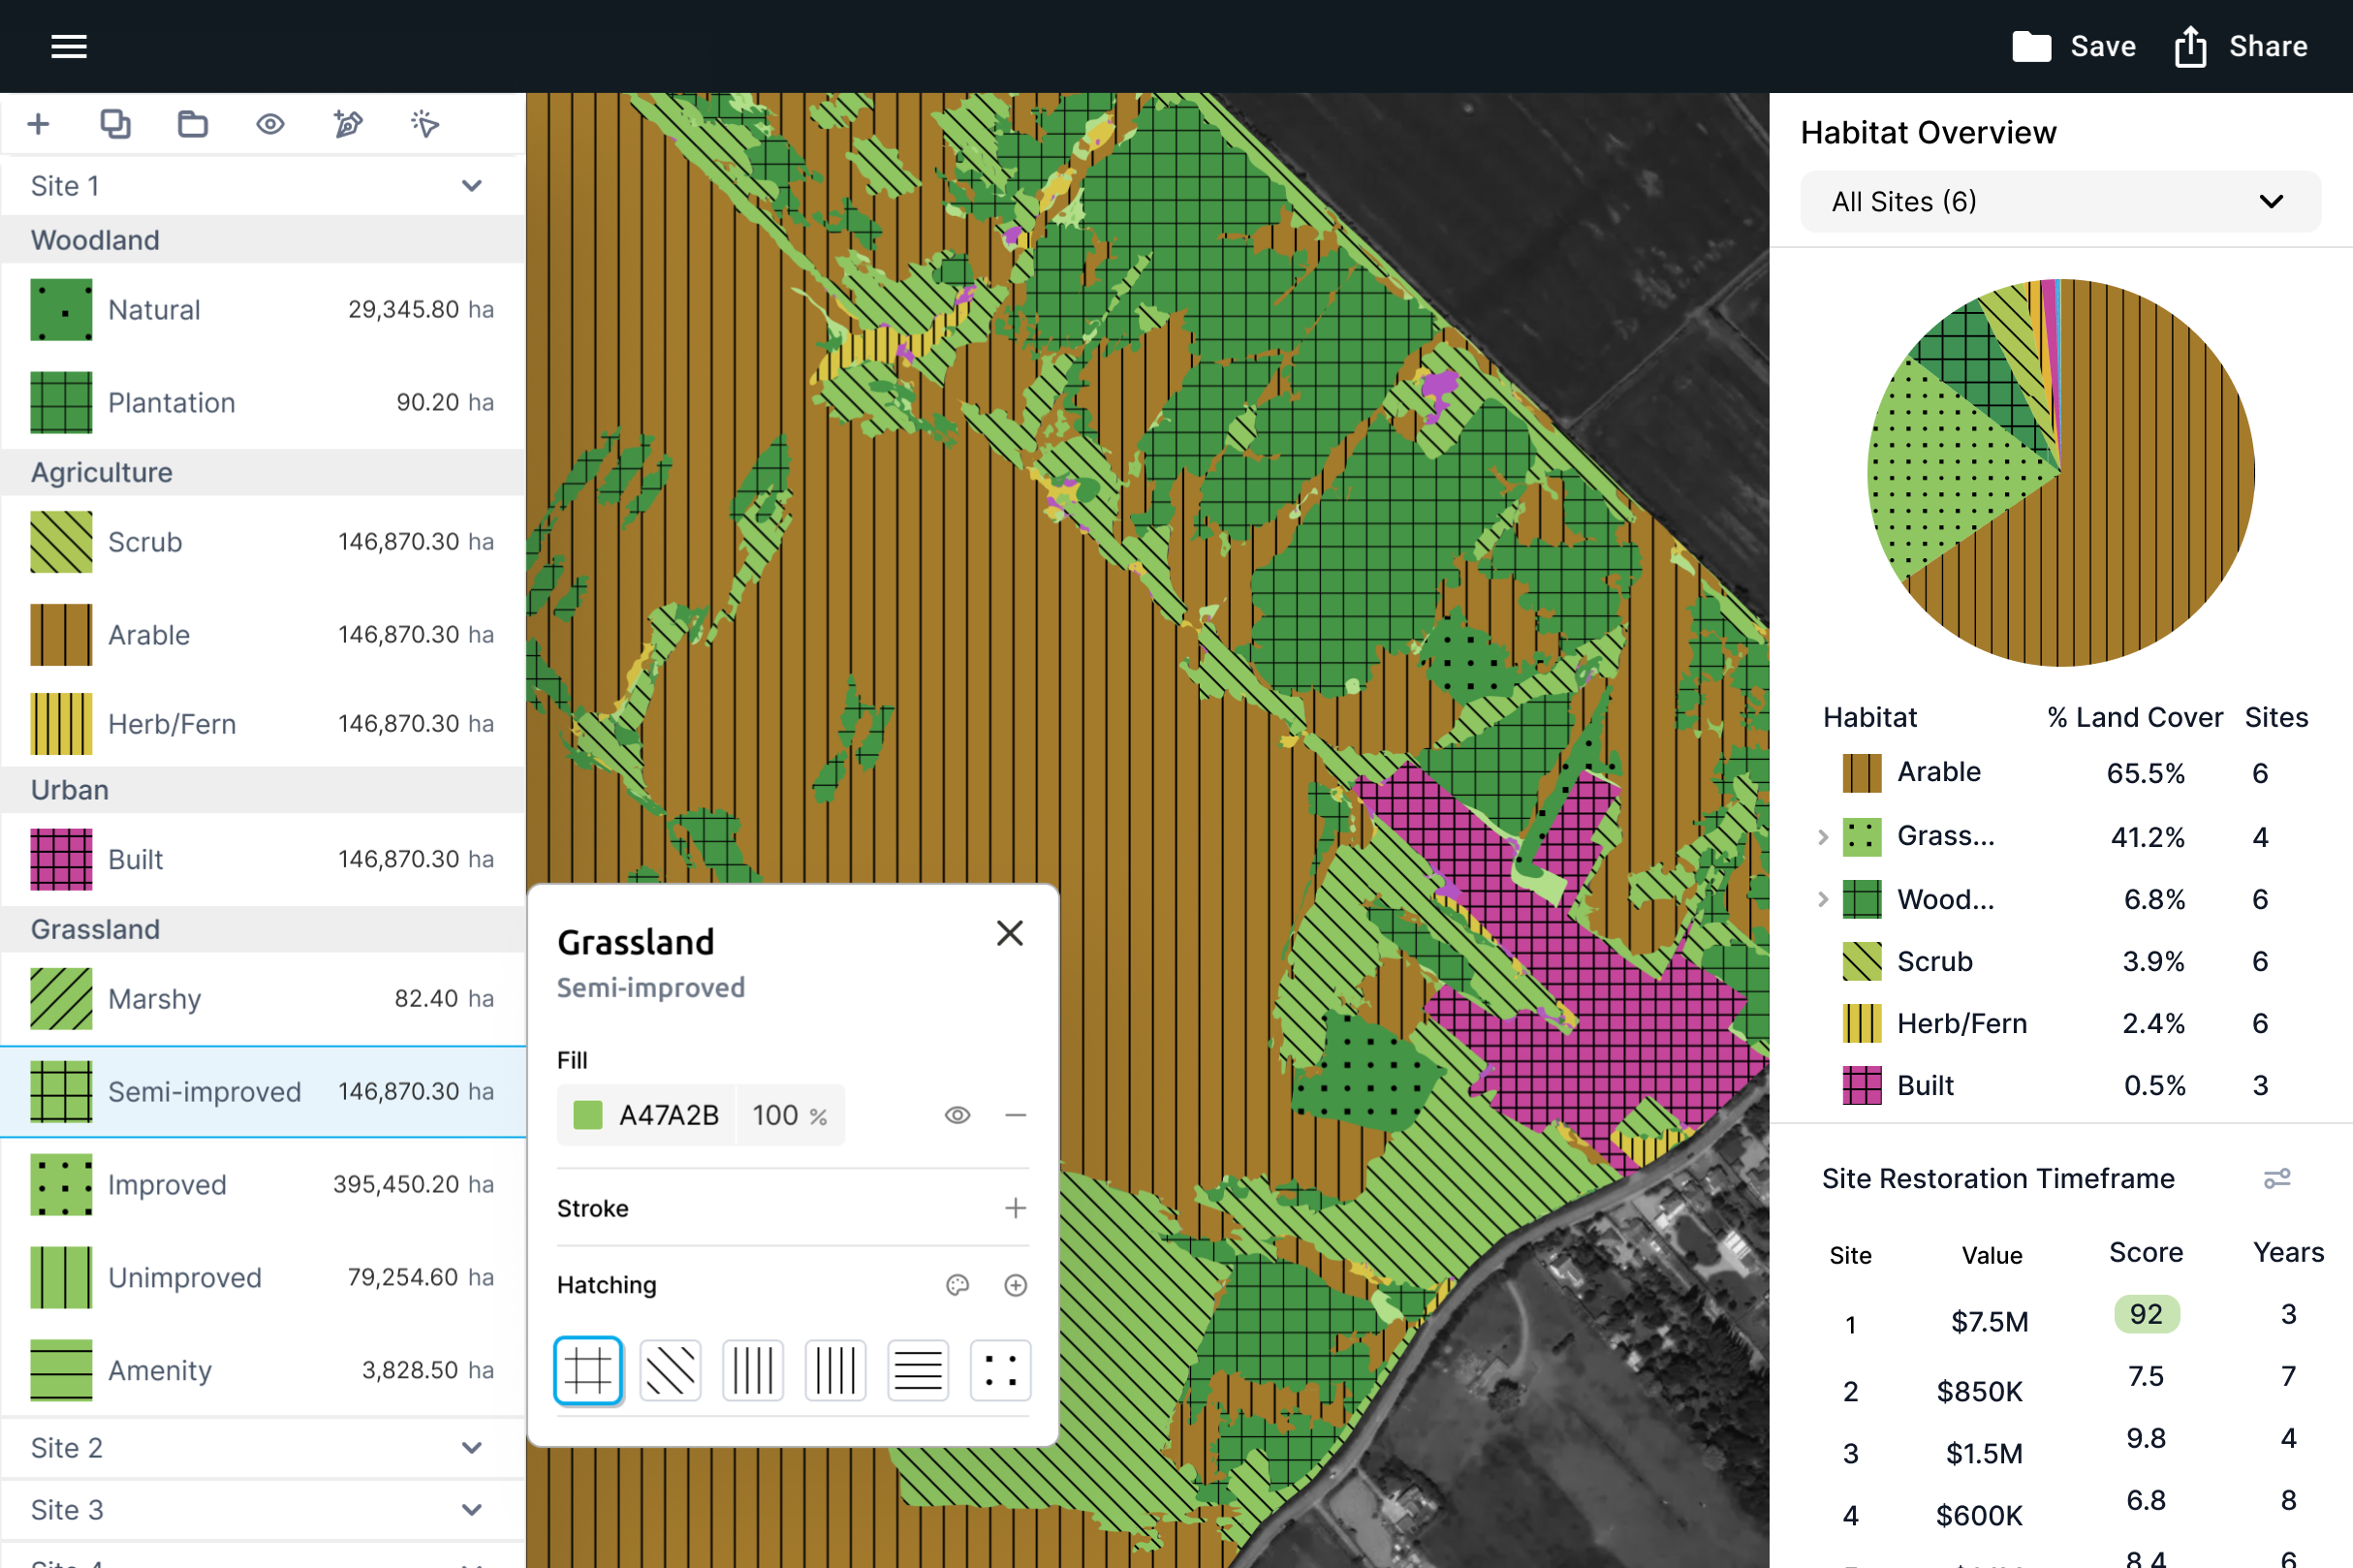
Multi-Site Management
View and edit habitat data across multiple project sites from a single interface, enabling efficient project portfolio management
Regulatory Compliance
Default labels align to UKHab standards for faster compliance reporting and automated export for regulatory submissions
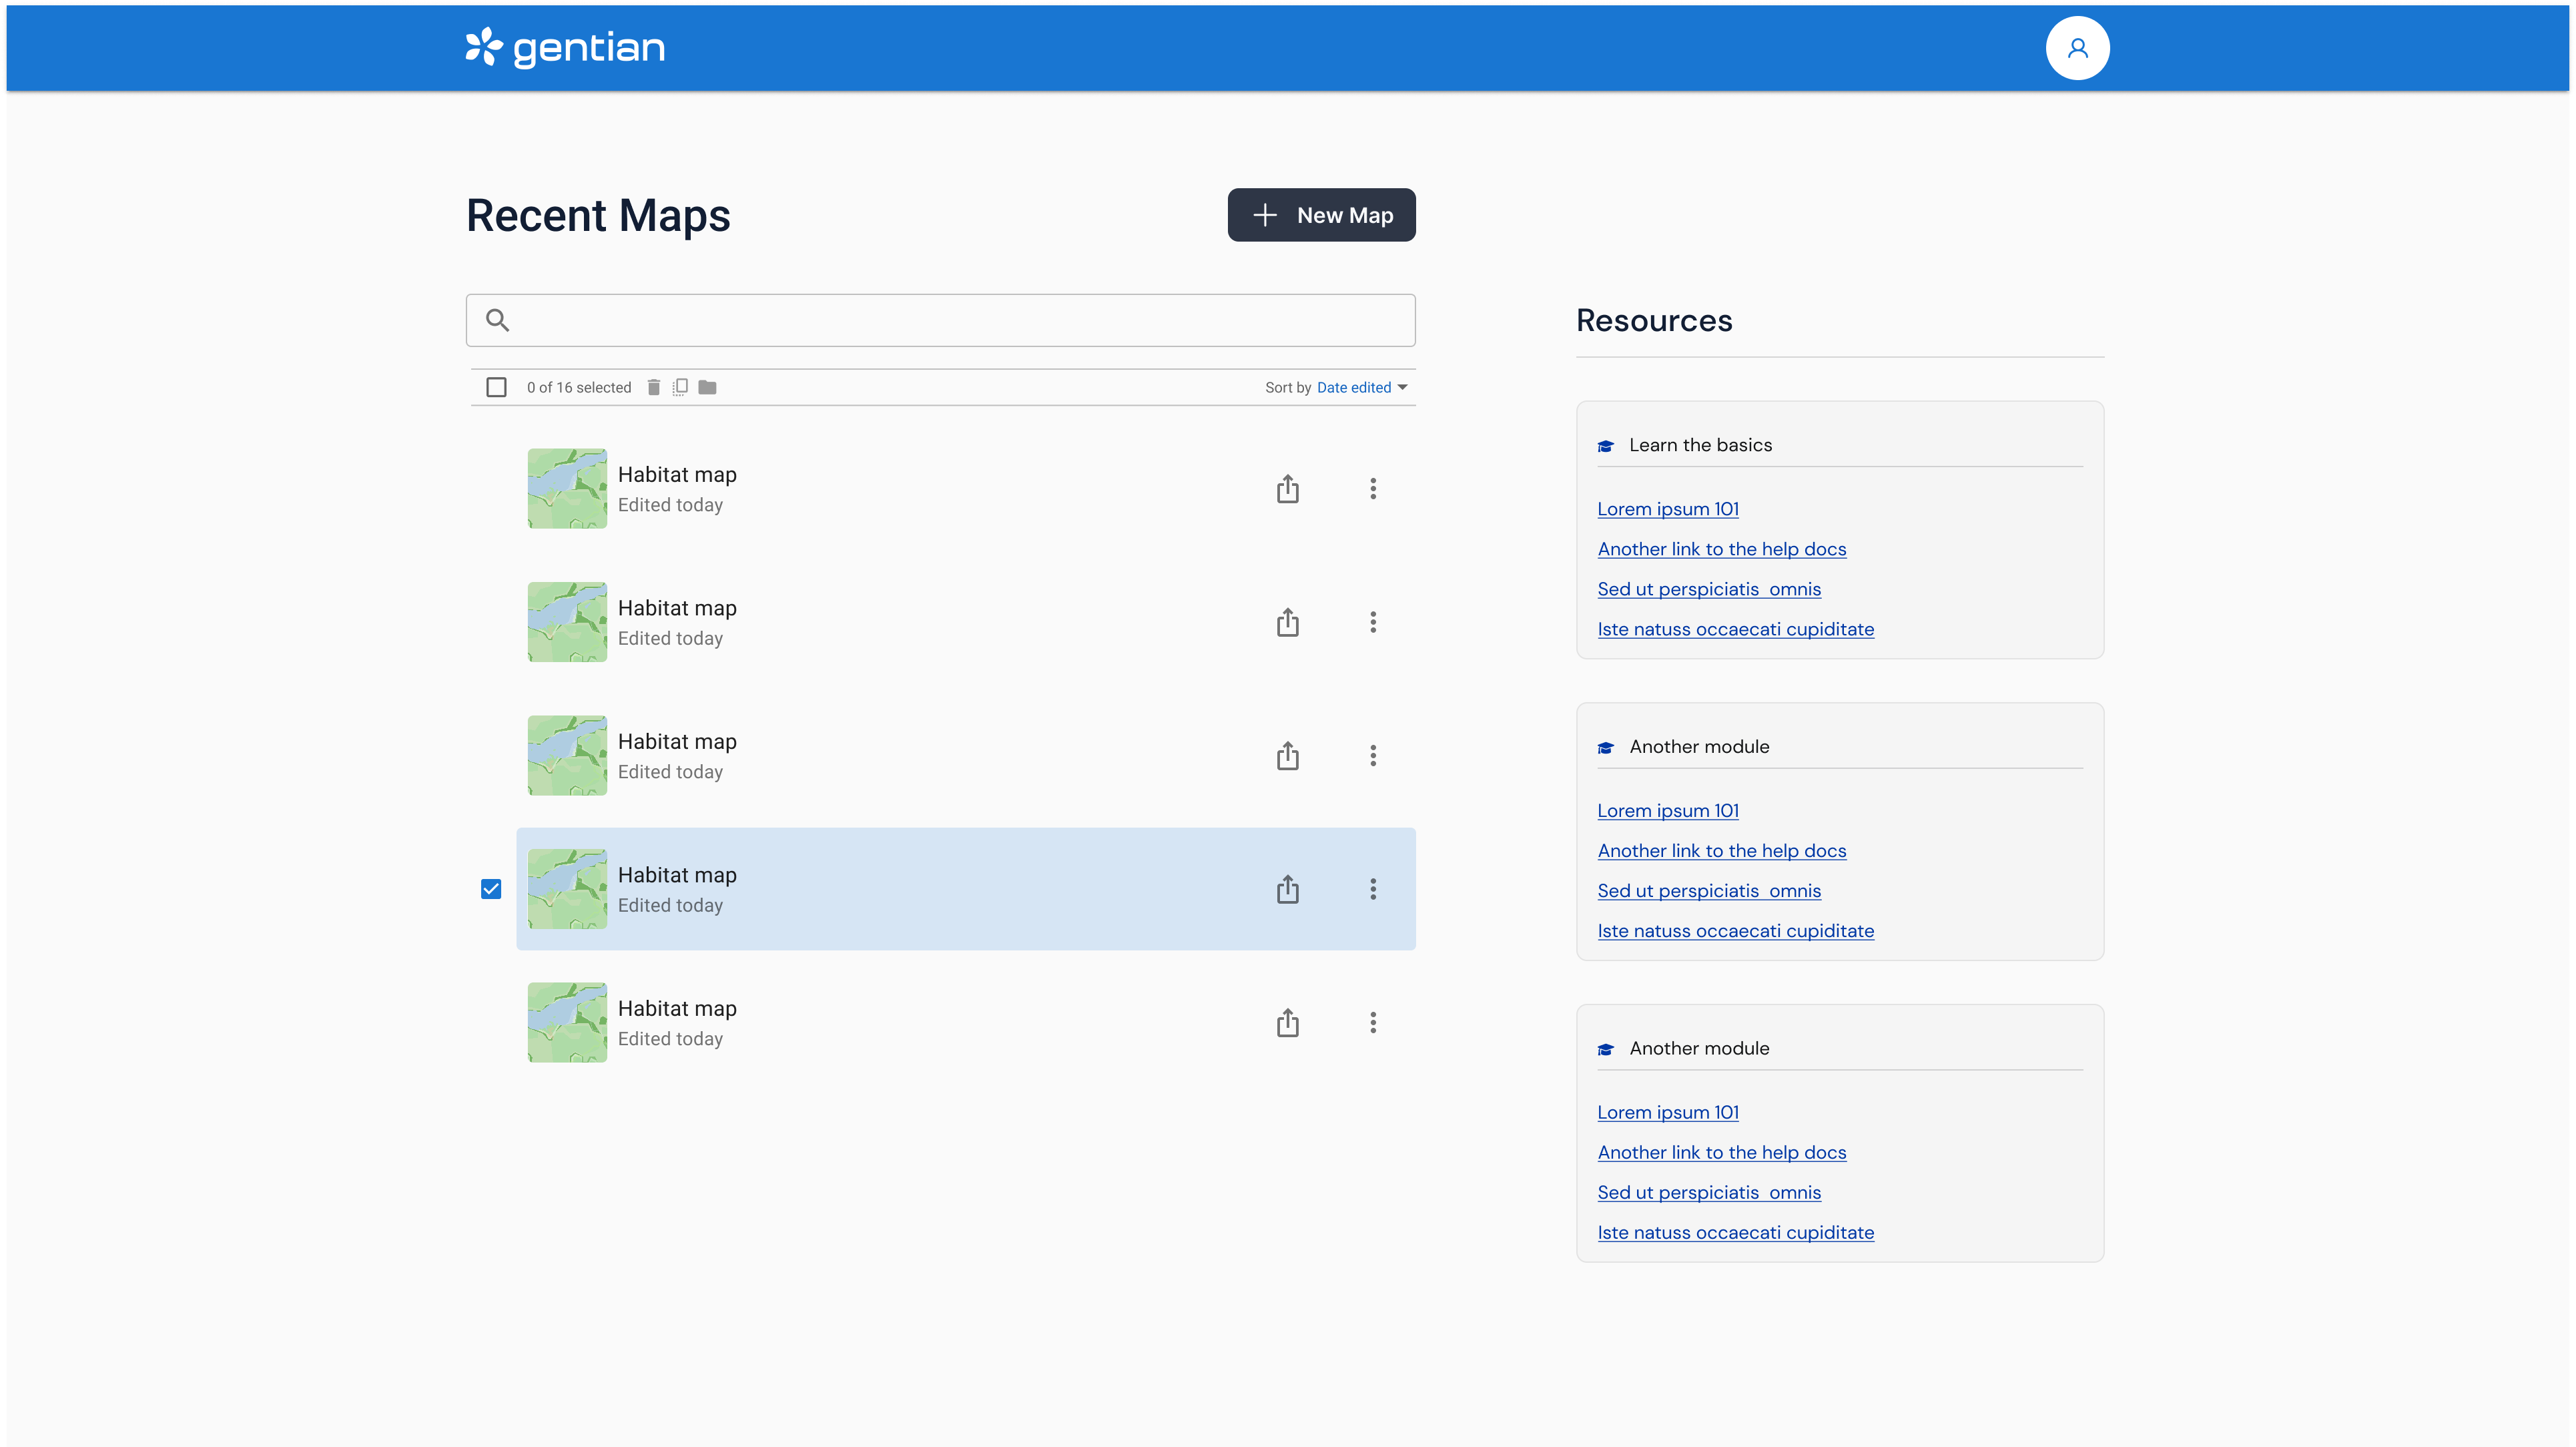
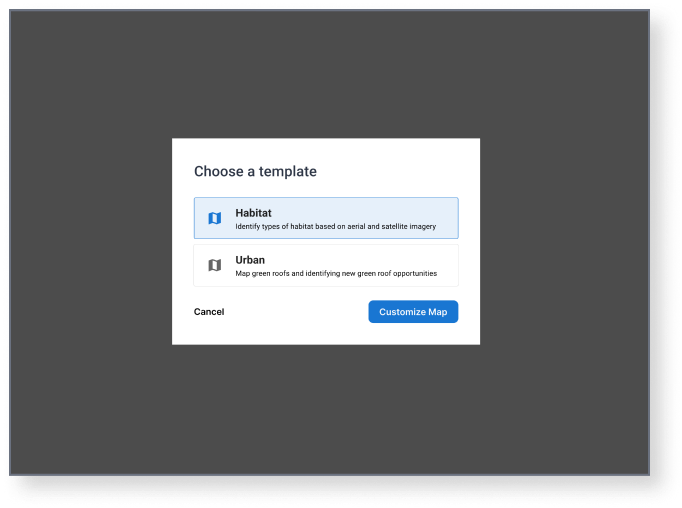
Home screen — View saved maps and start new projects easily.

Select between habitat for natural land cover or urban to identify green roofs and spaces.
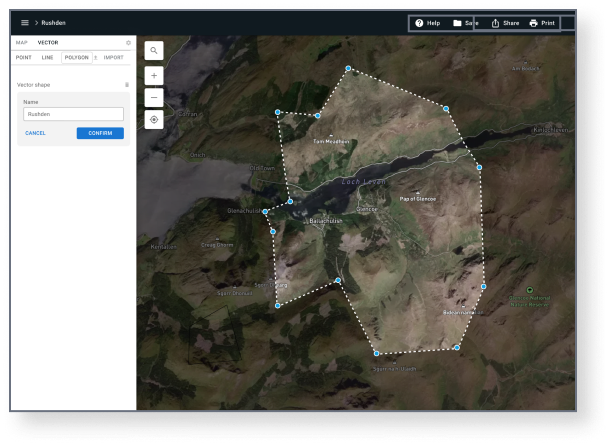
Define boundaries of analysis by uploading a file or drawing a custom polygon on the map.